Brand Visibility Across Personas

Gwen Sawicki, Research Assistant, Gumshoe

Nick Clark, Research Engineer, Gumshoe
Overview
As AI emerges as a more personalized search engine alternative (Aggarwal, 2024), many consumers have begun to use AI as a product discovery tool (SOCi 2026). To provide better recommendations, LLMs rely on a model of the individual user’s context supplied through the conversation history and current query. To replicate this dynamic, Gumshoe offers a persona-based analysis of brand visibility, where a persona is a structured profile fed to LLMs designed to simulate a specific relevant consumer. For example, Gumshoe might use “Value-Focused Household Grocery Planner” as a potential customer for Coca-Cola. This approach is essential as we’ve seen platforms relying on generic prompts find some brands have effectively no visibility, but in Gumshoe, we found they were visible in AI search but only to a particular set of personas. Additionally, LLMs can emulate human behavior patterns when instructed to behave like people using sociopsychological factors (Venkit, 2026). So, at Gumshoe, our personas use both phrasing and simulated context to capture these varied factors, allowing us to observe shifts in brand visibility across personas. To validate our methodology, we wanted to investigate if variance in brands recommended is primarily attributable to prompt phrasing or to Gumshoe's personalization modeling:
RQ: Does brand visibility vary across personas when prompt wording is held fixed? Is this consistent across verticals?
Process
We first looked to identify if there were statistically significant differences in visibility between different personas when the prompts were held fixed. This was done by running Gumshoe visibility audits where the prompts were set to be the same 10 question set for every persona. The question sets were made by exporting the original persona and prompt CSVs generated by Gumshoe’s defaults, feeding them into gemini, and asking it to create a broad set of questions that would be applicable across all the personas.
Testing For Significant Differences
We used a Cochran’s Q test, with the null hypothesis being that for a given brand, all personas have equal visibility
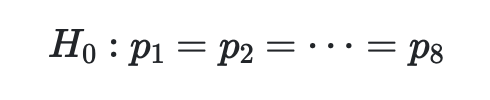
against the alternative that at least one persona has a different visibility probability.
What We Found
The table below shows the findings from using Cochran’s Q to test for significance. About half of the brands had statistically significant variance between their personas in brand visibility. This supports the conclusion that for some brands the variance in their visibility between personas is influenced by simulated context alone, not just what questions they ask.
Findings of Cochran’s Q Test
| brand | p_value | significant | q_statistic | degrees_of_freedom | |
|---|---|---|---|---|---|
| 0 | autoCamp | 0.428880 | no | 7.000000 | 7.0 |
| 1 | cocaCola | 0.000017 | yes | 34.045455 | 7.0 |
| 2 | hims | 0.051181 | no | 14.000000 | 7.0 |
| 3 | mercury | NaN | no | NaN | 7.0 |
| 4 | postHog | NaN | no | NaN | 7.0 |
| 5 | radPowerBikes | 0.015470 | yes | 17.315789 | 7.0 |
| 6 | sendCutSend | 0.003770 | yes | 21.000000 | 7.0 |
| 7 | warbyParker | NaN | no | NaN | 7.0 |
Visualizing the differences within brands between personas
We can also visualize the difference in visibility within brands. The Bayesian Beta-Binomial Model treats each persona’s total brand appearances across all personas, queries, and models as a binomial outcome, then uses a shared beta prior to partially pool the persona rates toward the brand-wide average.
How this model works:
- for each persona, it counts visible brand appearances across all persona, query, and model table cells
- it treats that count as a binomial outcome: visible hits out of total opportunities
- it estimates a latent visibility rate for each persona rather than assuming the observed percentage is the exact true value
- it combines the observed count with a shared beta prior, so each persona gets a posterior distribution for its latent visibility rate
- the posterior distributions are used here to visualize the likely range of persona visibility values within each brand under the fixed prior setup
Interpretation Info: The posterior curve shows which visibility-rate values are more or less plausible for each persona after combining the data with the prior
Note
- This test does not explicitly control for the fact that the same questions were asked to every persona, it only considers the total number of visible model outputs for each persona, not which question blocks or model families were driving the differences
- For the beta binomial summaries below, the persona-level visibility rate is based on all appearances across persona specific queries. This is useful as a descriptive measure, but might overstate the independence of the data as the outputs are coming from the same reused prompts.
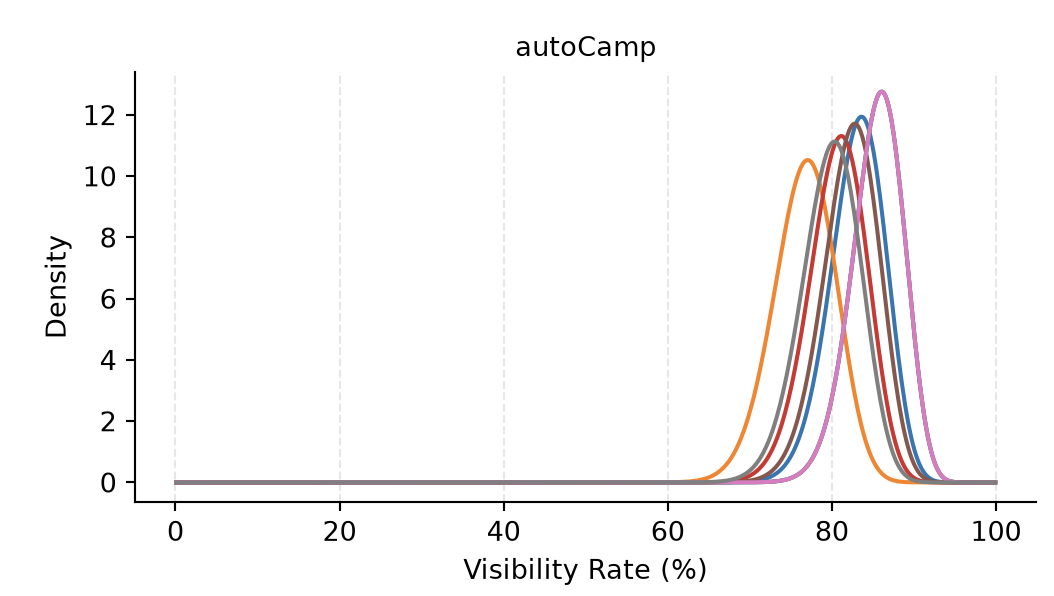
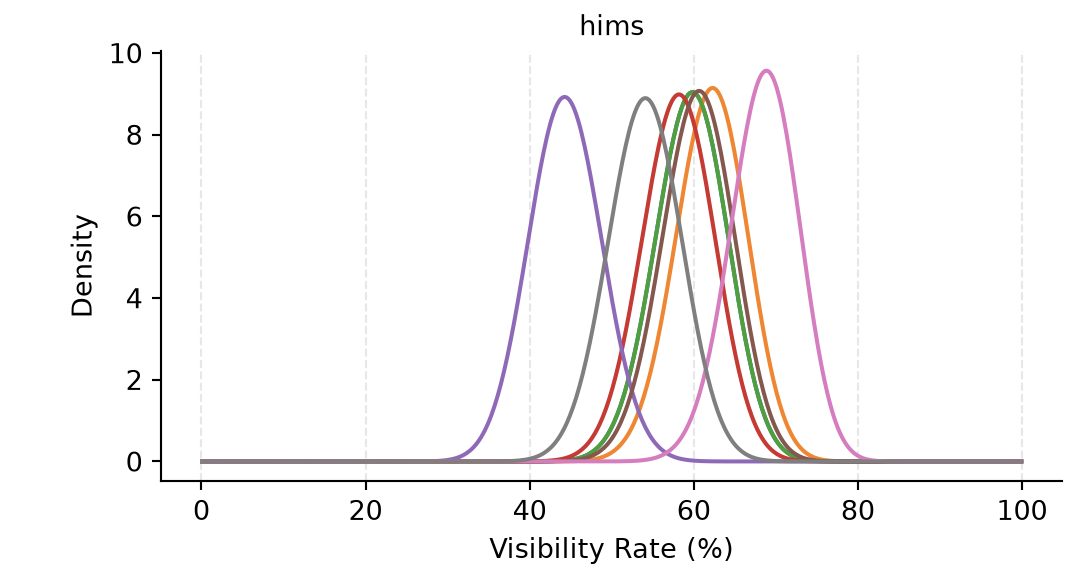
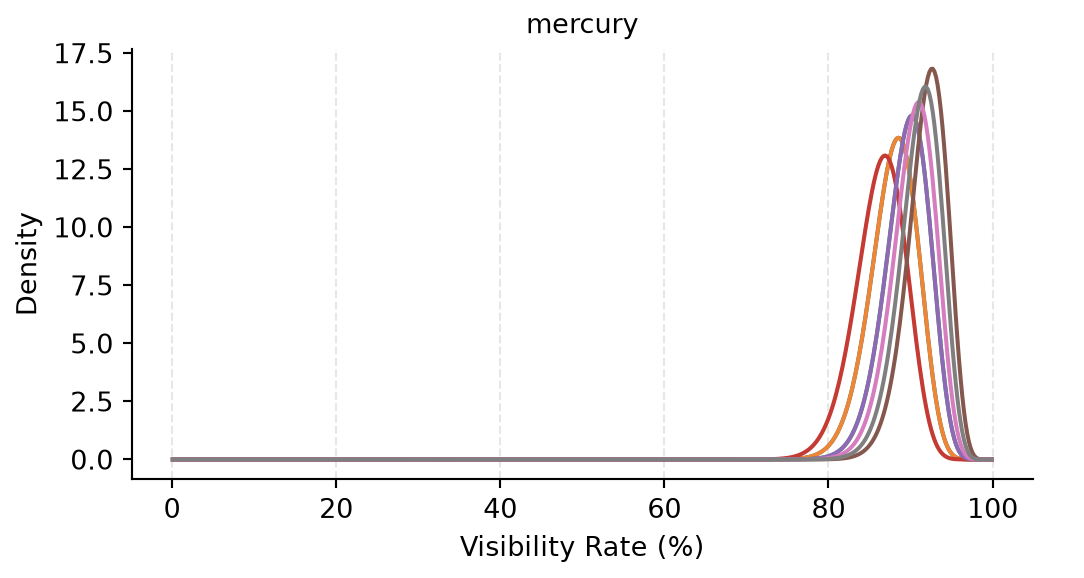
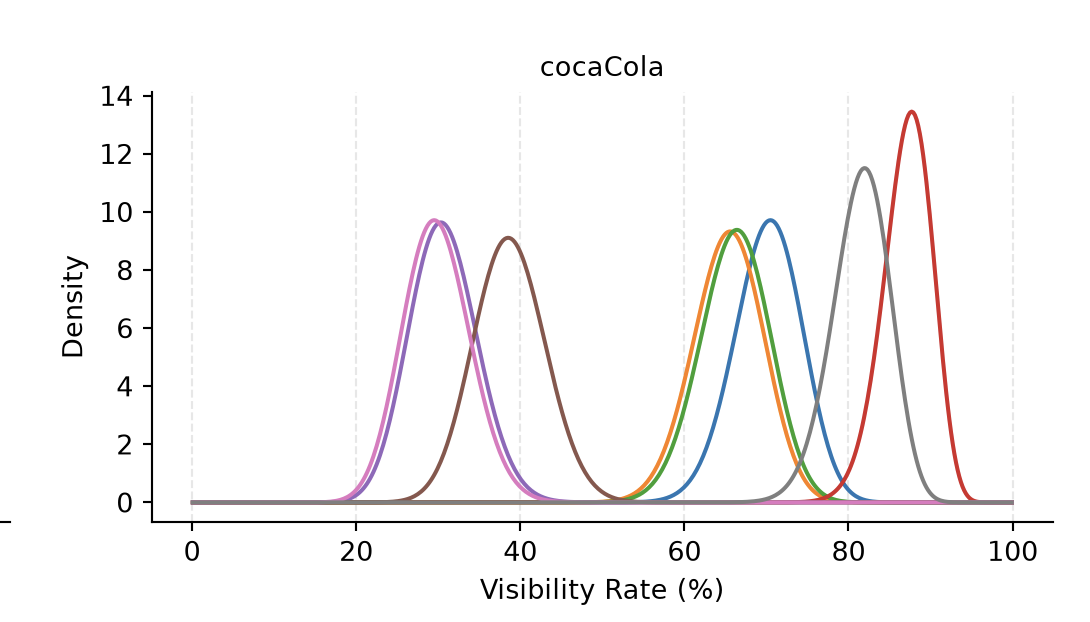
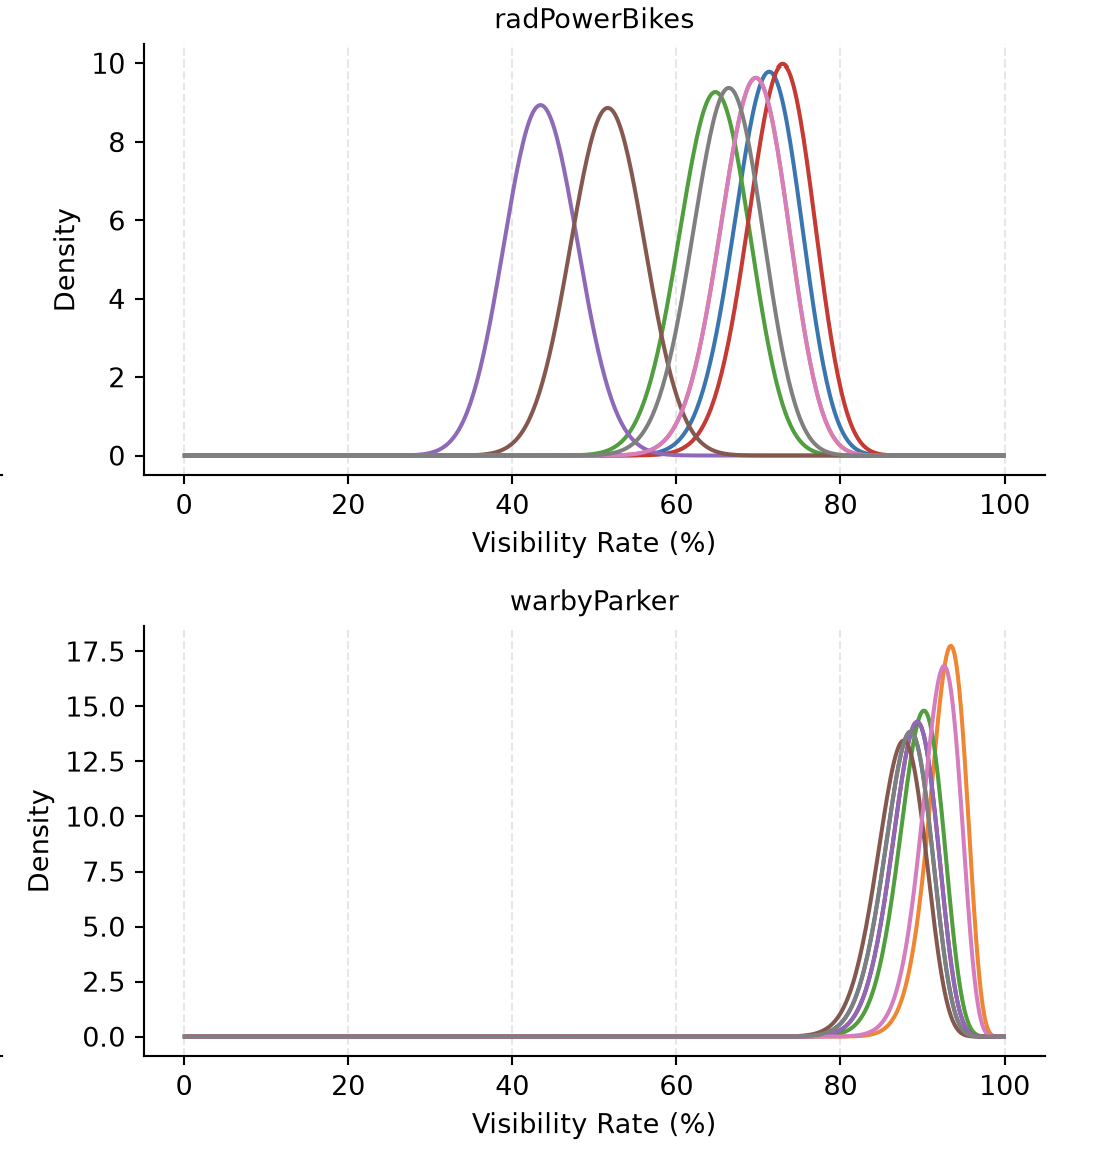
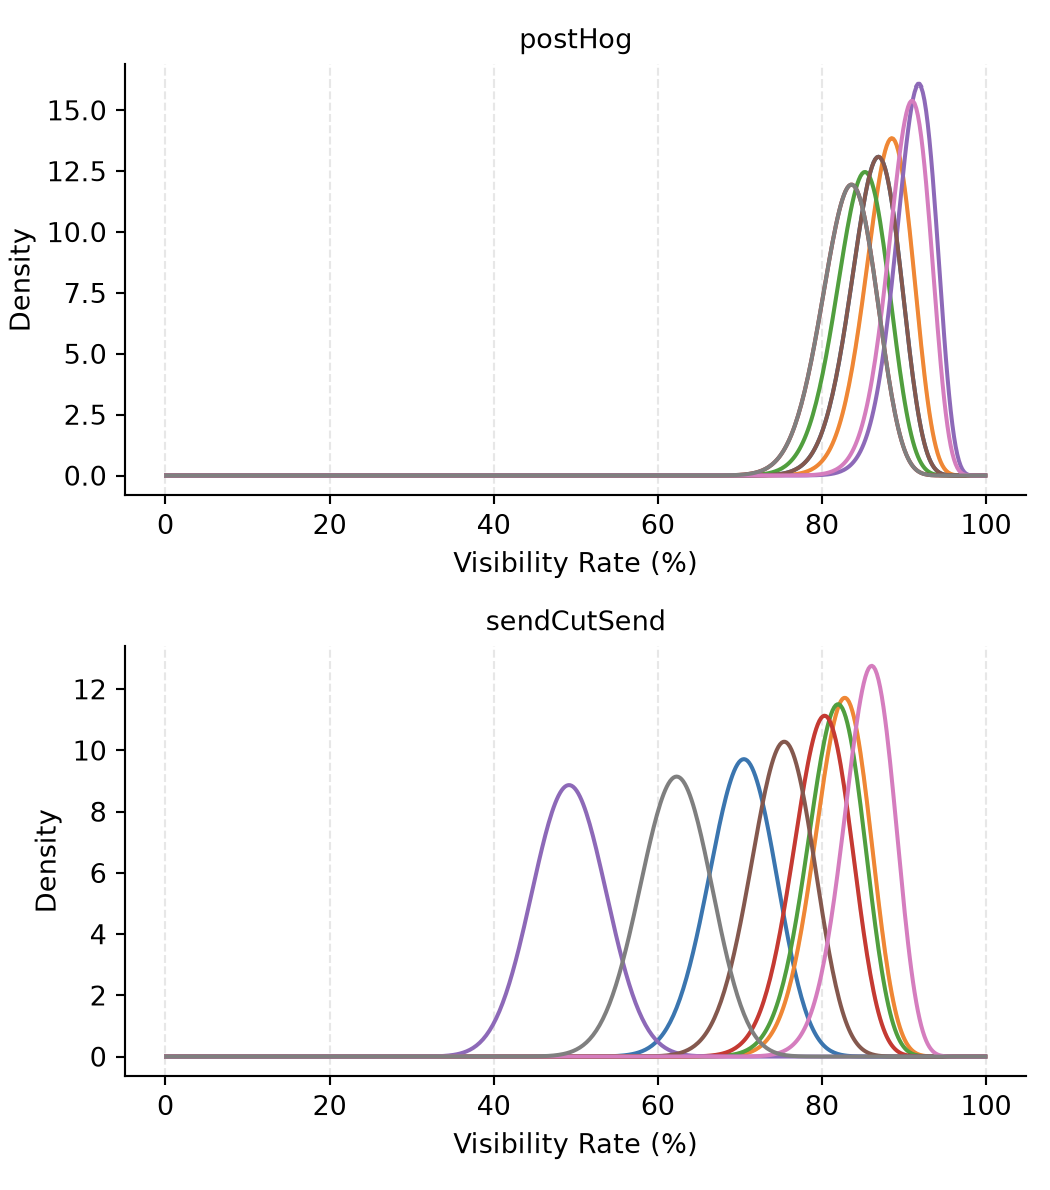
Visualizing Differences in Visibility Variance Between Brands Using a Kernel Density Plot
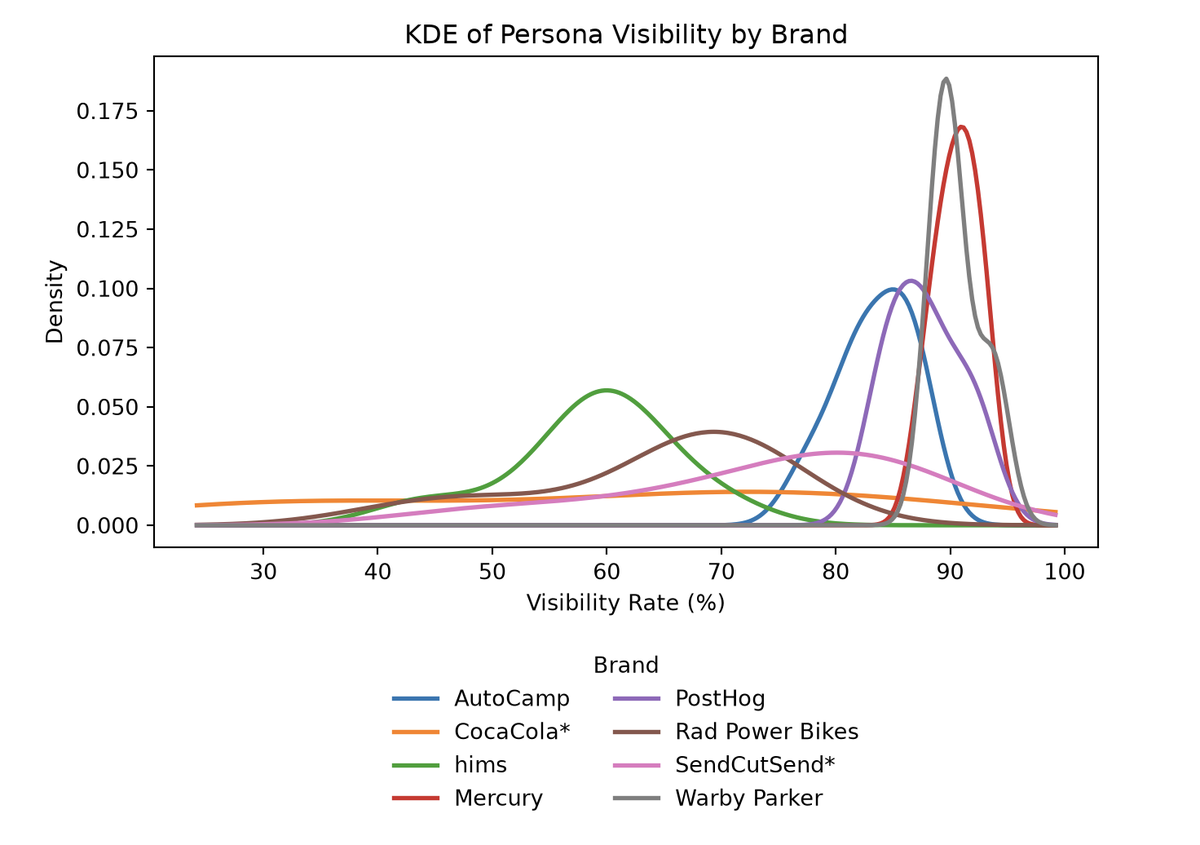
Additionally, we use Kernel Density Estimation to depict the distribution of visibilities by persona across brands. Those with more personas of the same variance have a high “spiking” curve, while brands that had many different levels of visibility across personas have gentle curves.
Quantifying Difference Levels in Personas
The Bayesian Beta-Binomial Models and Kernel Density plot revealed that there were not only significant levels of difference between persona visibility for some brands, but that the amount of visibility variance differed dramatically. Looking at those differences next to the layout of different personas and their descriptions from brand to brand, we noticed that some personas' descriptions were nearly identical, while some had completely opposite descriptions. For example, two personas from the Autocamp audit were “Wellness-Oriented Mindful Escaper” and “Comfort-Driven Nature Reconnector” which seem highly similar, while two personas from the Coca-Cola audit were “Trend-Aware Premium Beverage Upgrader” and “Value-Focused Household Grocery Planner” which are distinct. This led us to further investigate if the lower variance brands could be partially explained by a lower level of difference in character of the personas.
Current Character Scoring Methodology
To quantify the character of a persona, full persona descriptions and titles were passed to an LLM and scored across five dimensions on a 1-10 scale.
Persona Representative Identity Metrics (PRIMs):
These dimensions were selected due to their frequency of appearance across personas as well as their alignment with consumer segmentation systems for understanding buying criteria (Harvard’s Elements of Value, VALS).
- Economic: emphasis on economic value, price and affordability
- Functional: emphasis on product or service performance
- Operational: emphasis on convenience and reliability
- Relational: emphasis on trust-based factors like support, privacy or security
- Symbolic: emphasis on aesthetics, identity, status and brand values
Score interpretation:
- 1-3: low priority
- 4-6: moderate priority
- 7-8: high priority
- 9-10: critical
Visualizing high dimensional data is tricky, so instead I aggregated the difference by computing the Euclidean distance between every pair of personas:
The Euclidean distance between every pair of personas is computed following:

Then, all the individual pairwise distances are summed.
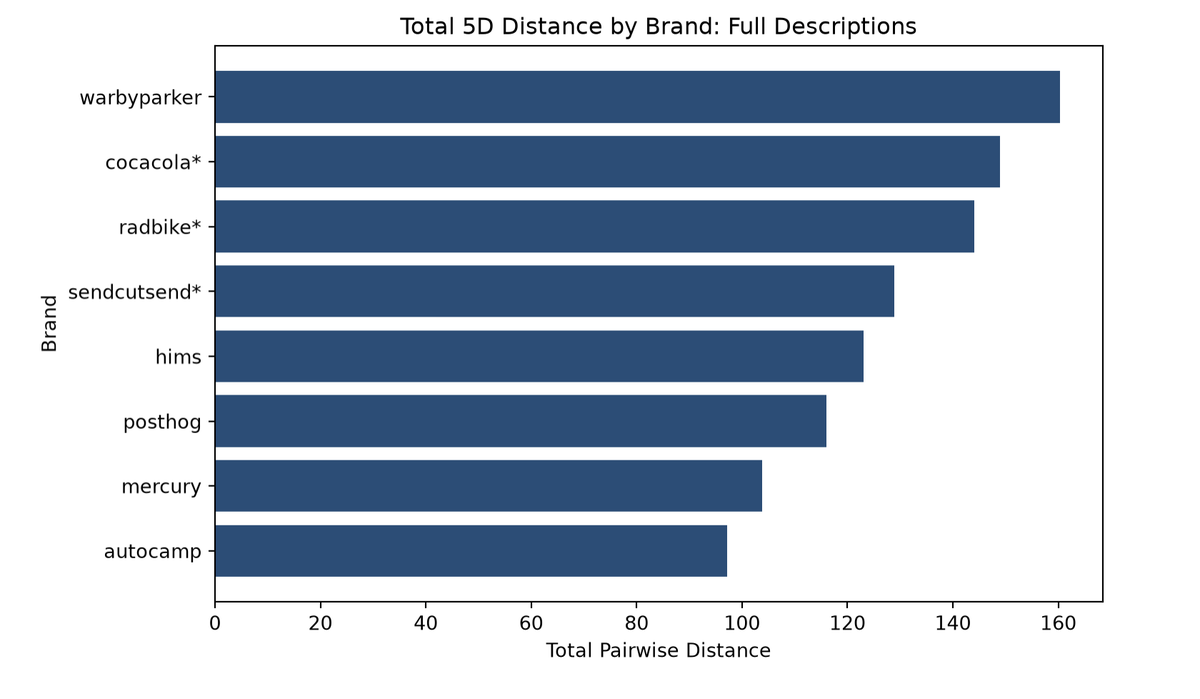
Comparing Differences in PRIMs to Variation in Visibility
This graph compares how much persona visibility varies across personas to how far apart the personas descriptions and values were by brand, quantified as the cumulative distance between personas in a brand’s 5D character scoring space.
This gives a better visual understanding of what the spread really looks like beyond the simple summed bar graph.
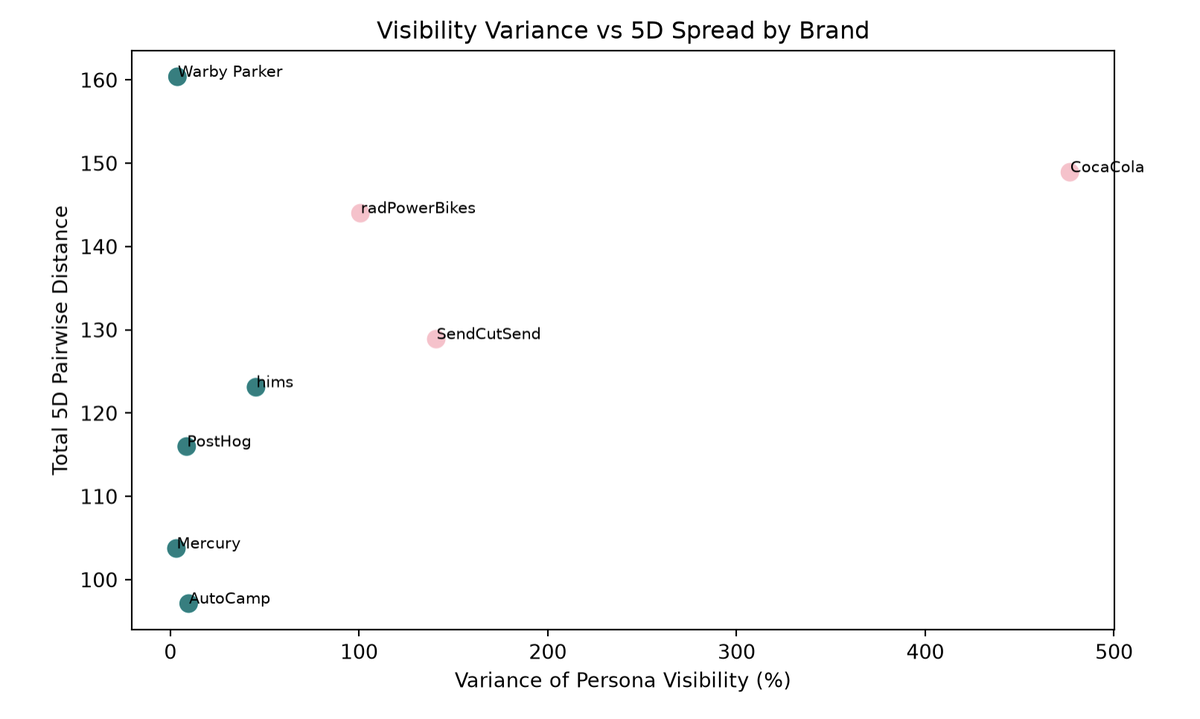
Pink points represent brands with statistically significant Cochran’s Q results.
Teal points represent brands without statistically significant Cochran’s Q results.
Overall we see that the brands with more total visibility variance are generally those that also had greater differences in their persona’s characteristics, quantified in PRIMs.
Notable Outlier - Warby Parker
In the above graphs, all of the brands are organized by the differences between their PRIMs, so the brands with more diversity in PRIMs their personas hold important have greater variance in the visibility of their brand as well. However, there is one brand that does not follow this pattern, Warby Parker. We hypothesize that the reason for this is due to Warby Parker's broad dominance across personas. Basically, because Warby Parker was winning in all five of the major factors that personas place more or less importance on, it does not matter who is asking a question because Warby Parker already beats out other competitors in all of these categories. This theory is supported by Warby Parker having high visibility for all topics (> 0.7) and being the most visible compared to other competitors by the greatest margin (> 0.3) within its visibility audit.
Why should you care?
The analysis revealed that there can be significant variance in visibility within a brand from persona to persona, even when questions are identical. Our analysis also points out that dominance of a market or lower difference in persona differences could be reasons for low visibility variance. These findings support that persona based analysis of brand visibility could be essential to brands developing a comprehensive understanding of their GEO performance as varied questions alone are not necessarily able to capture holistic and accurate GEO snapshots as LLM models can respond to different consumers differently even when asking identical questions.
Want to get the full picture of your AI visibility?
Sign up for free to understand how your brand appears across different personas, AI search engines, models, and categories. Get started
References
- Aggarwal, P., Murahari, V., Rajpurohit, T., Kalyan, A., Narasimhan, K., & Deshpande, A. (2024, August). GEO: Generative engine optimization. In Proceedings of the 30th ACM SIGKDD Conference on Knowledge Discovery and Data Mining (pp. 5-16).
- Venkit, P. N., Li, Y., Pruksachatkun, Y., & Wu, C. S. (2026). The need for a socially-grounded persona framework for user simulation. arXiv preprint arXiv:2601.07110.
- SOCi. (2026). 2026 Local Discovery Index: The verification loop [Report]. https://golocal.soci.ai/rs/355-TUF-572/images/2026_LDI.pdf
Ready to see your own data?
Run a persona-level AI visibility report across ChatGPT, Gemini, Claude, Perplexity, and more.
Free to start · No credit card required